
Description of the measurement method
This phase contrast and dark-field Micro-CT is a grating-based X-ray imaging system, which was especially designed for materials research and non-destructive testing measurements. The absorption- and phase-gratings allow for measuring the refraction and scattering of X-rays in addition to the attenuation of X-rays within the sample. While the refraction can provide higher contrast for various materials, the scattering signal contains information on the sample microstructure. This opens up new possibilities in research fields where the limiting factor for the application of X-ray imaging until now was the resolution. For example the scattering signal provides information on the fibre orientation in fibre composite materials. Another example is the temporal-evolution of a characteristic microstructure resulting in the hardening of cementitious materials. As this happens on a length-scale of a few microns; it can easily be studied by evaluating the scattering signal.
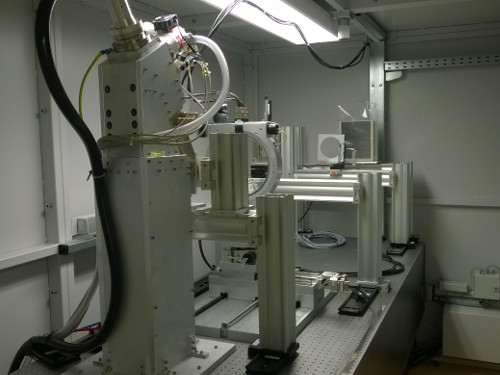
The setup with the X-ray tube in the front and the detector in the back. Between them we find the gratings as well as the sample stage ©05.
Spezifications
| Parametre |
Value |
||
| Energy | 60 keV | ||
| Field of view | 10 cm diametre | ||
| Resolution | > 10 µm | ||
| Exposure time | > 1 s | ||
| Max. sample mass | 250 g | ||
| Max. sample size | 10 cm x 10 cm |
Sample environment
The samples are mounted on an Eulerian cradle. In addition to the x, y and z direction the sample can be rotated around three rotational axes. This is necessary in order to perform simple tomographic scans as well as advanced tensor-tomography measurements. The sanmple size is limited by the field of view and should be below 10 cm.
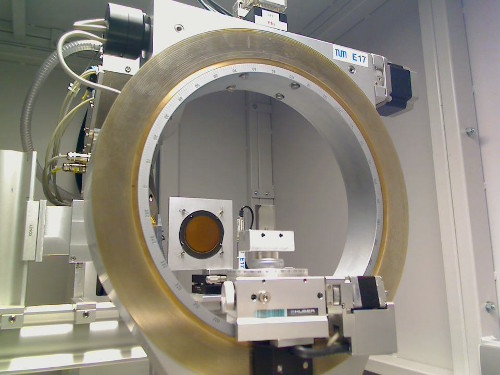
Photography of the sample stage. In this case the sample was a metal part ©05.
Example of application
The following example shows the three-dimensional fibre orientation within a knot of carbon fibres. In a tensor-tomography scan several tomographic scans of the sample are obtained [1]. For each tomography the sample is rotated around additional rotational axis. Therefore the scattering directions within each sample voxel can be reconstructed. In a tensor tomography dataset each voxel therefore contains a scattering tensor instead of a single value as it is the case for a standard CT. The vectors in the figure below illustrate the main orientation of the structures in a knot of carbon fibres [2]. The colour-bar indicates for the anisotropy of this orientation.
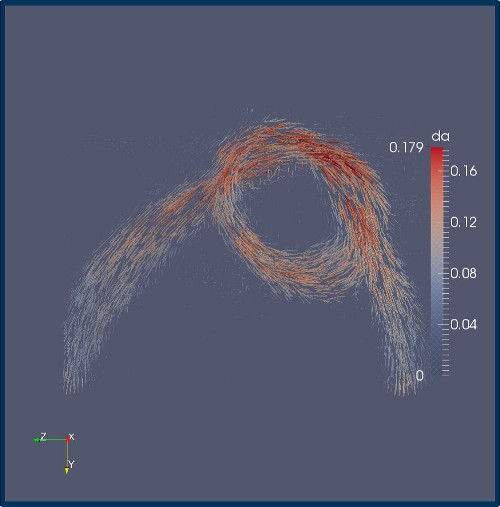
Three-dimensional visualization of the fibre orientation in a knot made of carbon fibres. The main orientation is indicated by the vector shown in each voxel while the colour encodes for the anisotropy of the sample structure in each voxel ©05.
Publications
1. Malecki A. (2014): X-ray tensor tomography. In: EPL. Vol.:105/3
2. Jud C. (2014) MSc thesis: Correlation of X-ray Micro-CT with X-ray Tensor Tomography
Contact
Institution: Chair of Biomedical Physics / TU Munich
Name: Friedrich Prade
Email: 
Tel: #49-(0)89-289-10833